![]() Cinema Journal Teaching Dossier
Cinema Journal Teaching Dossier
DH and Media Studies Crossovers Vol. 3(3)
Joel Burges, Nora Dimmock, and Joshua Romphf
University of Rochester
In this essay, we discuss a mode of reading we call “collective reading,” which continues and changes traditional shot analysis and emerges from three classes at the University of Rochester: “The Poetics of Television,” “Film History, 1989-Present,” and “Clocks and Computers: Visualizing Cultural Time.” In these classes, we aim to bring data modeling and data visualization into how students read media. This mode changes shot analysis because it collectivizes it. Students work together at all phases, from initial shot analysis of entire films, television episodes, and even seasons, to final essays. Crucially, we introduce data modeling and data visualization, which has resulted in a fruitful mix of shot analysis as a mode of collective close reading, and data visualization as a mode of collective distant reading. A final characteristic of collective reading is its social energy: its mix of debate and dialogue over what a data point “is,” and the anxieties and occasional anger such debate induces among the students as they figure out how they know what they know about a data point. This sociality often results in a speculative ethos grounded in error—in what we call the “right to be wrong,” making them readers of the very method by which they arrive at a humanistic claim.
Shot analysis is a long-standing tradition in the film and media studies classroom. In the most common version of this practice, enjoyed by at least a few generations of students, the student is given a short sequence from a film. The student must then break the sequence down into its constituent formal parts, identifying techniques as they work their way through the sequence shot by shot. Such close attention allows the student to comprehend the “grammar,” “syntax,” and “language” of the film—metaphors from the world of words that some would say lead us to wrongly think of ourselves as “reading” films (Bordwell xiii), while others remain committed to “the slow, hard tussle of reading texts closely,” and “the deep attention required for interminable difficult reading” (Brinkema xiv). In the shot analysis, the student reads the language according to shot types, editing and lighting techniques, description of mise-en-scène, and so on, compiling an organizational chart of its particular syntax, which may reflect the normative grammar of a particular mode of production such as classical Hollywood cinema or art film (see figure 1).
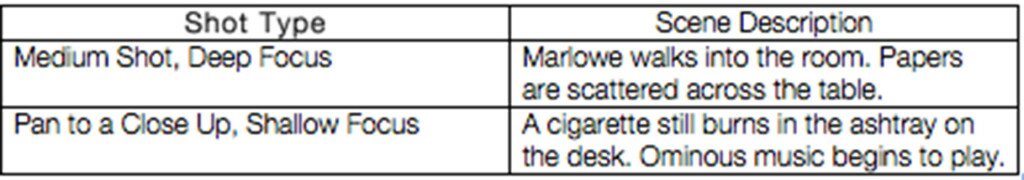
Figure 1: Hypothetical Shot Analysis Chart
Such charts find an apogee in the “interminable difficult reading[s]” (Brinkema xiv) of Raymond Bellour’s The Analysis of Film, most notably the over 100 pages devoted to North by Northwest, though such difficult duration can also be found in the shorter essay on The Birds, “System of a Fragment.” These are precursors to what we now call “data visualizations,” except that they required no computers at all: charts like the one above, if infinitely more detailed, and diagrams of the spaces of and movements in the films.
The impulse behind instructing students in shot analysis is thus threefold: analytical, a breaking apart that Bellour’s title “System of a Fragment” encapsulates; empirical, a means of systematically naming what the student observes in a film fragment, especially formally; and visual, even ekphrastic, a diagrammatic and descriptive organization of what has been observed in graphic form. As such, it is the basis for a close reading, frequently a revelatory interpretation of how formal analysis exposes a deeper meaning in relationship to content. Shot analysis teaches students how to read a film closely, and it usually teaches this “how to” as a solitary endeavor. The individual student pores over a sequence and captures the minute details of its language so as to have objective evidence for her close reading, also understood as emerging from an individual interpreter.
In our courses, this entire reading process is collective from start to finish. We grasp this process as reading because it entails a reflexive and recursive process of deciphering moving images in and over time. This definition of reading is nothing new, extending back to the literary critic I. A. Richards (Guillory 20)—and we have embraced that. What is newer about this process of reading is that it is centered on a digitally mediated engagement with film and television that further deepens students’ social acts of observation, interpretation, and explanation. What is further new—or at least different—about our process is that we not analyzing shot types, marking editorial techniques, and describing the mise-en-scène in charts like the one above. We do mark shot occurrences, that is, whenever a new shot begins. But the data we gather about those shots relates to the ways in which the narrative unfolds in time and space (see figure 2; for definitions, see Appendix A).
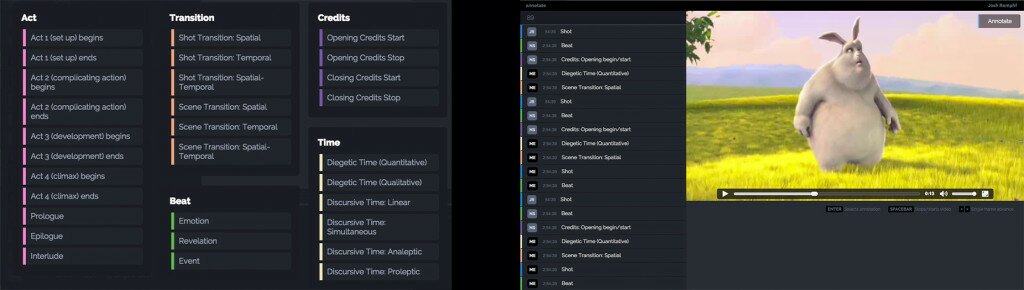
Figure 2: Data Model and Current Shot Analysis Tool
So, for example, a student will consider whether a shot starts or ends a scene; whether that shot is a transition in space, time, or both space and time; and whether the temporality of that transition is linear, simultaneous, analeptic, or proleptic in relationship to the sequence of events in and over time. The data model stresses narrative as a function of space and time far more than it does the editorial and stylistic language described above. The pedagogical rationale for this data model stems from our desire to teach students to think about the relationship between the most fundamental unit of moving image media, the individual shot, and how narrative arises by way of time and space.
This reading process entails three major phases, which take a semester to unfold: 1) collaborative shot analysis of moving-image media conceived as data collection; 2) collective visualization of that data on the basis of a hypothesis formed during data collection; and 3) a co-authored essay loosely based on the genre of the lab report or white paper in which equal attention is paid to explaining methodology and interpreting film and television. Students work in groups across all of these phases. In “The Poetics of Television,” such groups have been typically organized around genres: sitcoms and cartoons, soap operas and period dramas, and procedurals. In “Film History” and “Clocks and Computers,” groups have been organized around one or two films. The reasoning for groups is that we want the students to know more than the system of a single fragment, to evoke Bellour’s essay on The Birds. We want the groups to analyze entire films and television episodes, and to share what they learn with other students in the class, who then might use each other’s data in their respective final essays. By doing so, we get multiple fuller fragments. In other words, each collection of data about a film or episode is in itself complete. But for the students, another group’s completed data becomes a piece of puzzle, one that they can assemble with the data other groups gathered.
During the first phase, the students are given digital files of the films or television episodes, annotating them shot by shot according to a pre-determined data model focused on narrative time and space (see figure 2 and Appendix A). Sometimes students have added their own markers to the data model, with a great of deal of interest in characters and locations. We’ve come to understand the first phase as collective reading not only because of the collaboration in annotating the shots, but also because it is remarkably social, focused on debates around the epistemology of the data model. Put more simply, students have anxiously argued about how they know what they know. For example, one student reflected in her final essay that as a result of marking them over and over again, she had come to understand a term she had heard for years, but which she now knew up close: what a scene is.
The technologies we have used inevitably mediate the epistemological dimension of collective reading because the data collection process requires students to view the films or television episodes shot by shot multiple times—and to argue over what a data point is. We have experimented with several different technologies, always working with a digital file of the film or episode. In the first iteration of teaching shot analysis as data collection, students used a free cross-platform subtitling program called Jubler, which was useful because they could mark the data points as the film or episode progressed. However, shot detection is not automated in Jubler, with students needing to mark “1” for each shot as it opened (see figure 3). This was deeply frustrating to many students because of the sheer number of shots. Thus in a second iteration, we moved to the free version of DaVinci Resolve, a color-grading tool widely used in post-production to automate shot detection. First, DaVinci could detect shots and display them in a format that shows what is in a given shot frame by frame; below the display of frames, it visualizes shot changes and shot duration with a green line of varying intensity; and to the right of those lines, it lists each shot change and the time code at which it occurs (see figure 4).
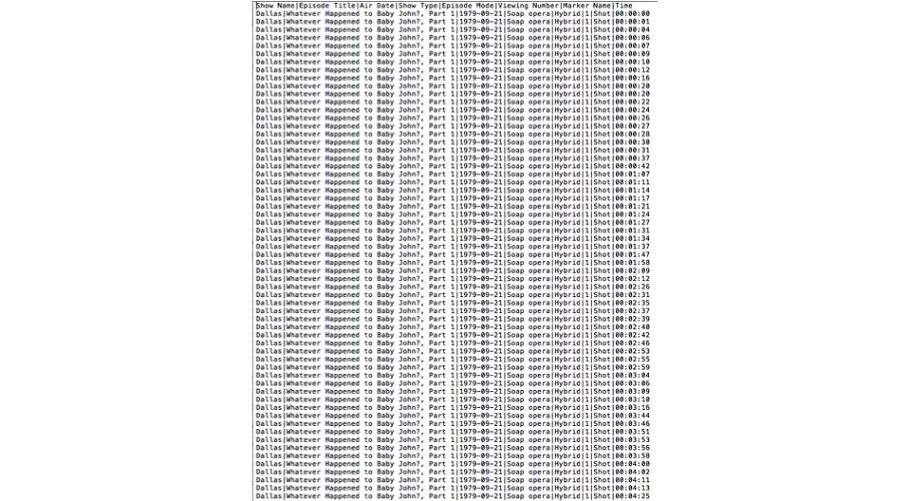
Figure 3: Student mark-up of Dallas, done in Jubler
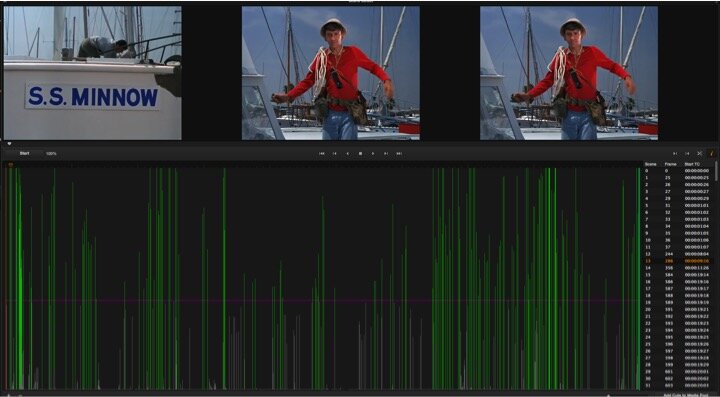
Figure 4: DaVinci shot analysis of Gilligan’s Island
The technology itself was reading film and television, just as when the students used Jubler, the marking they did constituted a kind of reading. But not having been designed for this precise purpose, DaVinci at times failed to distinguish shots, meaning students had to go back and check—or re-read—the shot analysis created by the software. Once the DaVinci file was fully marked for all shots, it was imported into Adobe Encore’s subtitling engine, where students then marked—re-reading closely yet again—the rest of the data points. In the third iteration that we are currently launching, data collection occurs through a single web application, developed by the Digital Humanities Center staff at the University of Rochester, with the three of us leading that project, in order to fully streamline the process. Students navigate video files through a custom interface that mimics a non-linear editing system akin to Final Cut Pro, Adobe Encore, and DaVinci Resolve. The interface connects directly to a database that students can query and edit in real time, and that can produce CSV files for visualization at any point (see figure 5).
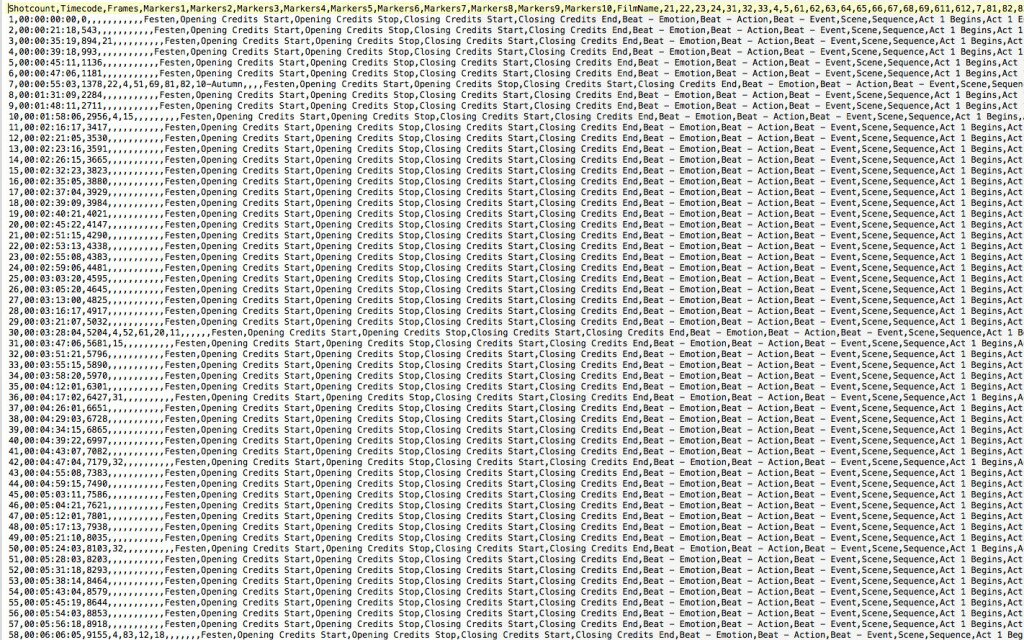
Figure 5: Student CSV File of Festen
There is also functionality for peer review, so the students can flag and provide rationales for markers they deem incorrect, placing them in dialogue with the data and each other. Across these iterations, the technologies have participated in the reading process by which students have come to know what they know—what a scene is, what a shot is—precisely because they have allowed them to decipher what they see, to read the moving image in digitally mediated and remediated forms. And this reading has always been something they have done together.
What has marked that “togetherness” as social, especially vis-à-vis the epistemology of the data model, has been the worried controversy over the meaning of data points: for example, the beat. Various scholarly books and screenwriting manuals define what a beat is in radically different ways: as every action that generates a reaction, as coterminous with a scene, as a significant pause in the dialogue, and so on. We defined a beat as a notable “punctuation mark” significant to the unfolding of a film or episode, most typically the story. It is an element you largely feel. Even once we defined beats in terms of emotion, information, and events (see Appendix A), the definitions produced intense debate over what a beat is and how you mark it due to competing experiences of a film or episode from student to student. While such debate engenders the sociality of collective reading, what makes that debate part of a process of close reading is how the technologies bring the students into deep, direct, and dialogic encounters with narratives as data. At some level, the mere fact of us calling a beat “data” worried the students so much that both what a beat is, and what data itself is, came into question in the classroom. Data became a medium the students read and re-read, not something that was simply a given–or given to them.
How data is or is not a given is a matter that digital humanists such as Daniel Rosenberg and Johanna Drucker have been addressing both historically and critically. However, what we have observed is that in translating qualitative concepts into data points such as “beats” is truly troubling to students, indeed, such that many of them steadily embrace error as a fundamental possibility in what they are doing. A speculative ethos thus becomes a central feature of the knowledge they produce.
That ethos is partly the result of the students’ collective reading and social re-reading of the data they collect. But it is also visible in their final essays, where the distant aspect of collective reading emerges vis-à-vis data visualizations. Many students have been inspired by the interesting diagrams, scatter plots, bar graphs, trees, maps, and networks that abound in Franco Moretti’s work in books such as Atlas of the European Novel, 1800-1900, Graphs, Maps, Trees: Abstract Models for Literary History, and Distant Reading. Recalling the charts and diagrams in Bellour’s The Analysis of Film, Moretti’s is a graphic mode that students have replicated in both static and dynamic forms. For instance, one group of students—Hobert Thompson, Scott Williams, and Joshua Romphf, when he was a student—created animated character networks of Seinfeld and The Simpsons using D3, a Javascript visualization library developed at Stanford University (see figure 6.1). As figures 6.2 and 6.3 show, the network of the animated comedy is far denser than that of the live action comedy. That density makes intuitive sense, enabling the formal hypothesis about medium and character at which the students arrived: Animated series will tend to have more characters and thus more interwoven character systems precisely because they are animated. The economics of the medium (one need not find and hire a new actor or actress for each character) along with its material basis (the ability to draw a new character that can be re-drawn at any time) yield medium-specific possibilities for character systems.
Figure 6.1: D3 code by Josh Romphf and Jeff Suszczynski for Seinfeld character networks
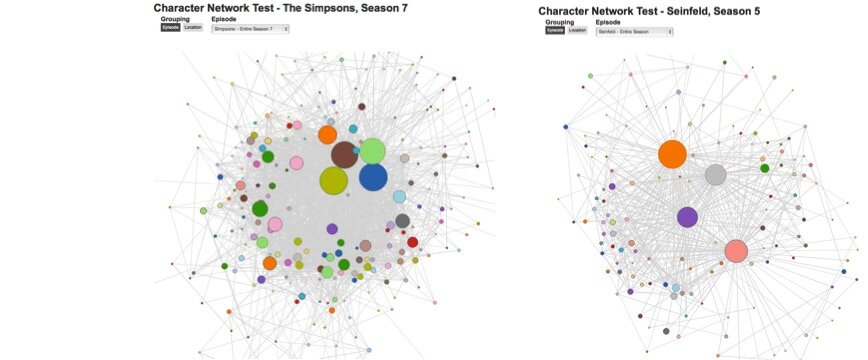
Figure 6.2: Character Networks of The Simpsons and Seinfeld
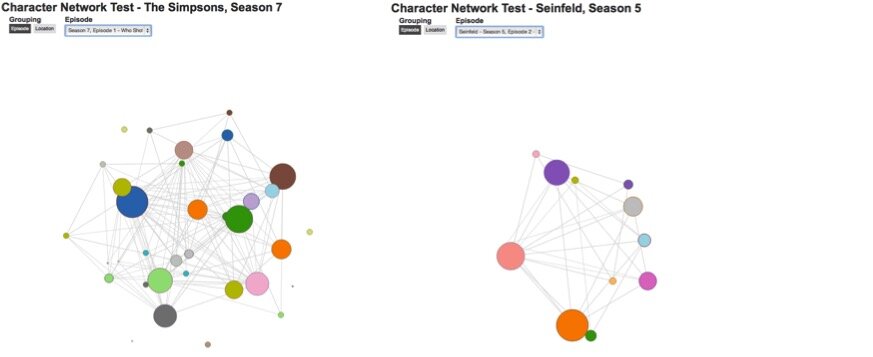
Figure 6.3: Character Networks of The Simpsons and Seinfeld
In a final essay entitled “Spaces and Agency,” a different group argued that “[t]hrough the collection of data, we realized the depiction of space in a television series has a strong correlation to the series’ presentation of differing social classes” (11). This realization was not entirely surprising given the series being considered were Upstairs, Downstairs and Downton Abbey. But the students who wrote this paper—Jennafer Galligan, Madeline Kushner, and Brynn Wilkins—also made other hypotheses based upon their visualizations of the spaces in the two series. First, narrative space has become more complex in the period drama between the 1970s and the 2010s. For instance, figure 7.1, which includes a hyperlink to a YouTube video made using Google Maps, Flash, and Adobe Illustrator, shows that Downton moved to exterior locations far more often than Upstairs. It did so in order to construct a more detailed picture of village life, interestingly, out of locations hundreds of miles away from each other. Figures 7.2-7.5, made using Microsoft Word, show that architectural space also became far more complex in relation to class in Downton in contrast to Upstairs.
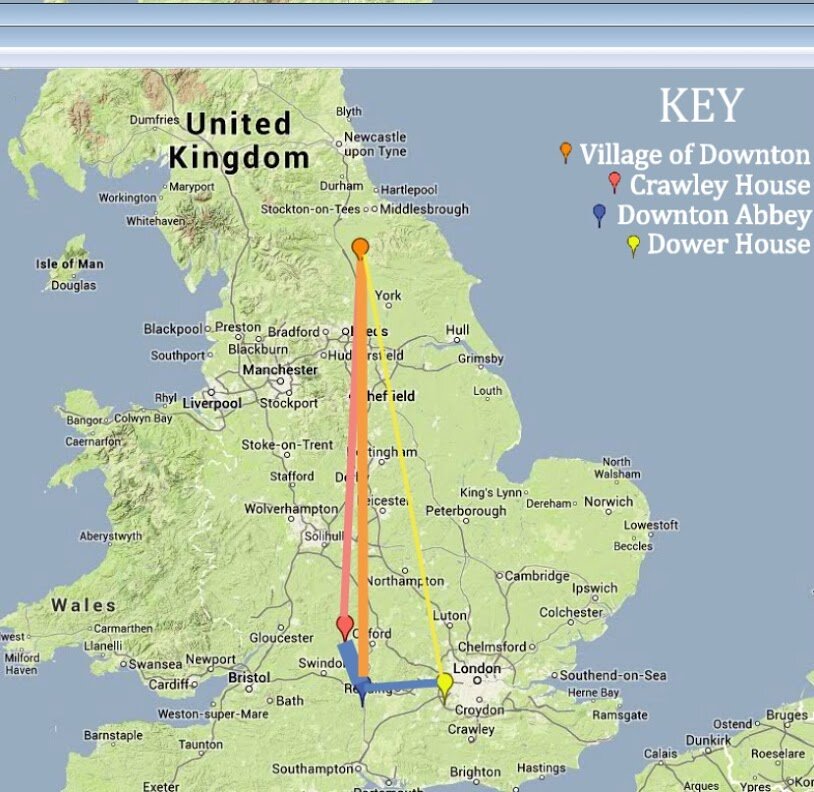
Figures 7.1: Map of Downtown Abbey filming locations by Brynn Wilkins
(For making of 7.1, see https://www.youtube.com/watch?v=gEy3i2QGAdc&feature=youtu)
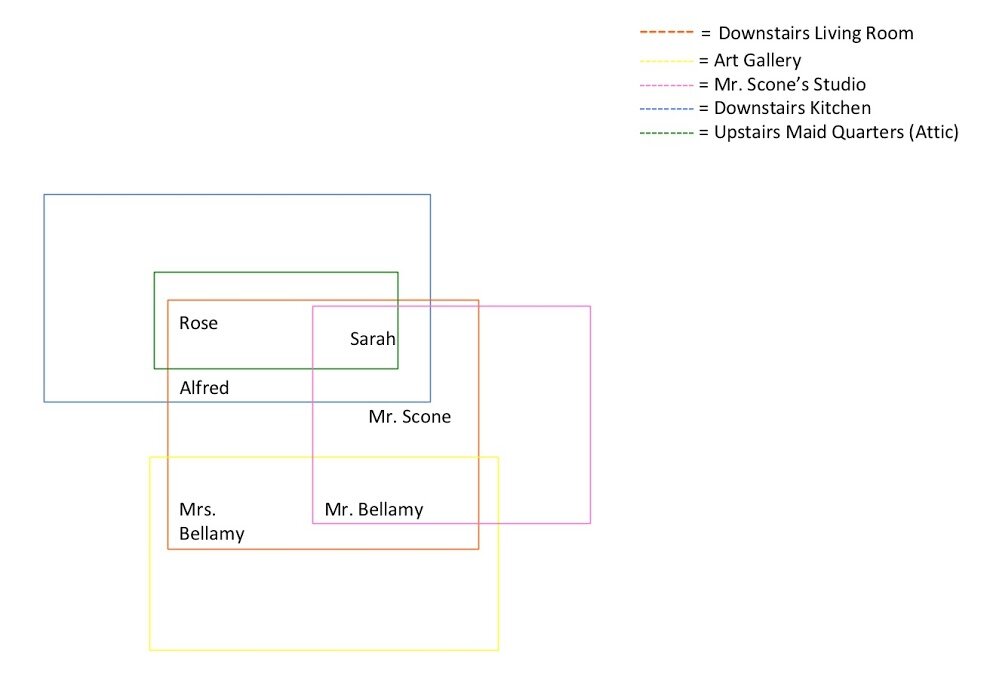
Figure 7.2: Spatial diagram of house on Upstairs, Downstairs by Jennafer Galligan
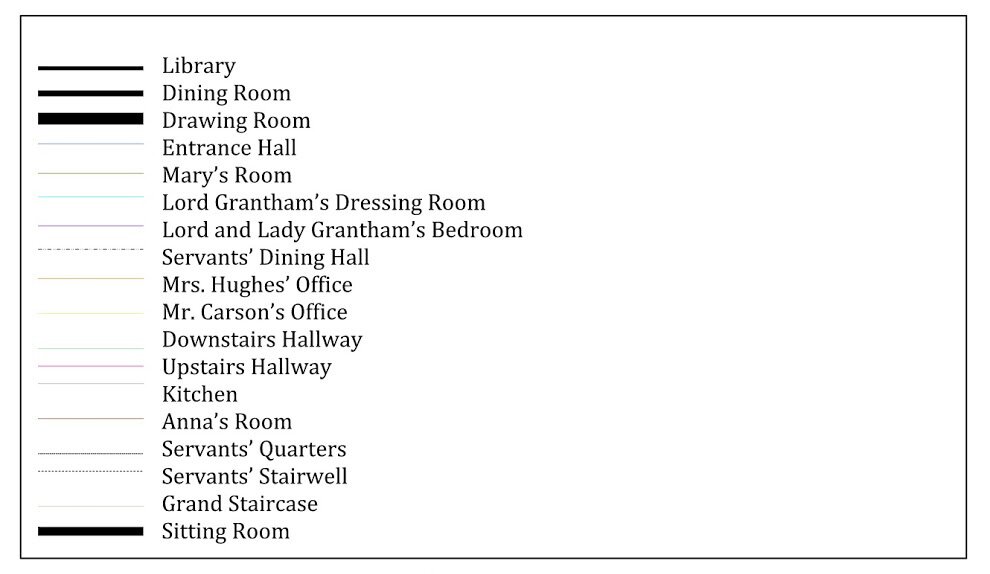
Figure 7.3: Key to spatial diagrams of house on Downton Abbey by Madeline Kushner
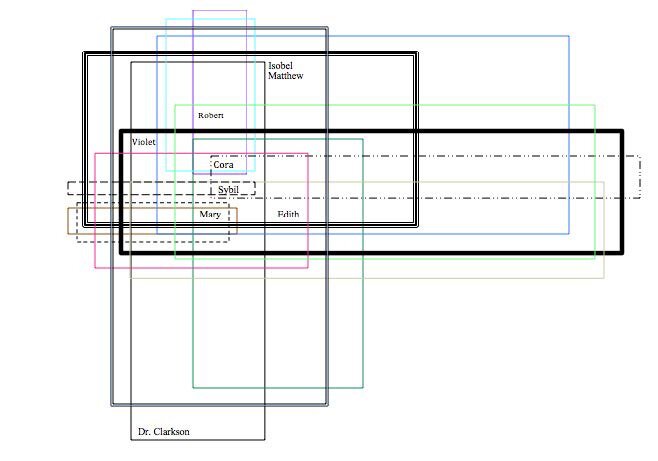
Figure 7.4: Spatial diagram of upper class space on Downton Abbey by Madeline Kushner
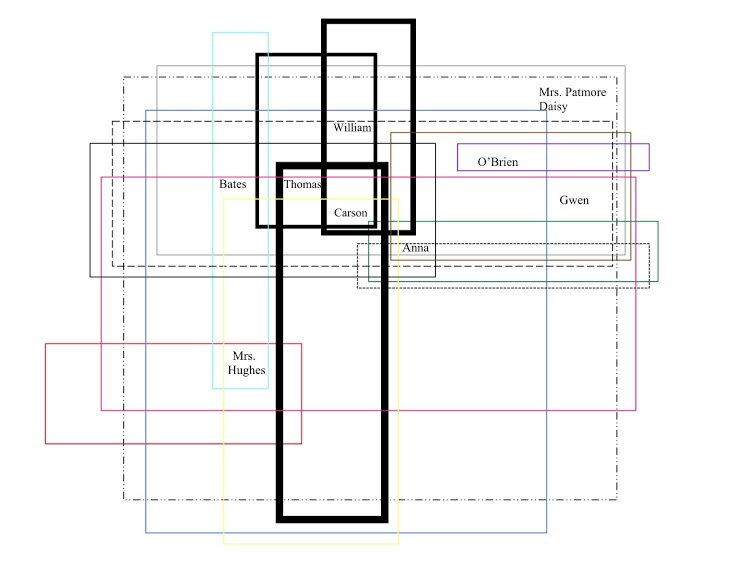
Figure 7.5: Spatial diagram of lower class space on Downton Abbey by Madeline Kushner
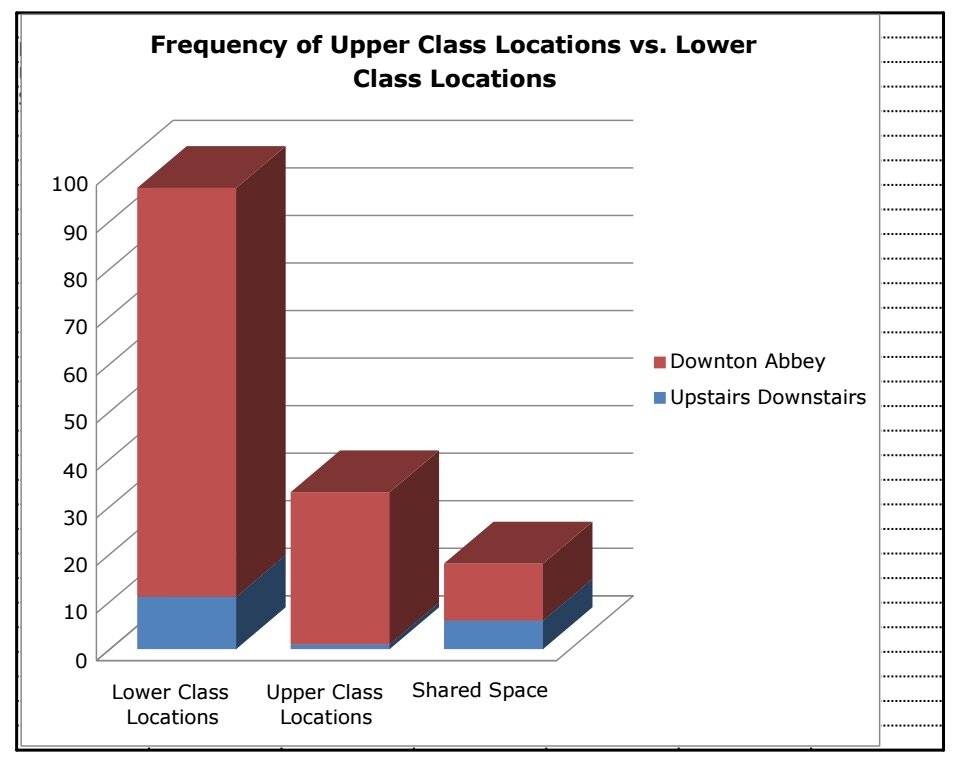
Figure 8: Bar graph of frequency of class locations on Downton Abbey, by Jennafer Galligan
Despite this compelling difference in spatial complexities over television history, however, both series mapped a relationship among space, character, and class. It is at this point that the correlation Galligan, Kushner, and Wilkins initially observed went from being intuitive to interesting. Lower class characters more frequently occupy both lower and upper class spaces than upper class characters. As figure 8 shows, the number of “lower class locations is significantly higher than upper class locations in both shows” (16). For these three students, this frequency sparked them to speculate about the contradictory narrative agency of lower class characters as plotted by space. According to these students, the characters with the least social power appear more frequently, on the one hand, because they are “props” in the upper class spaces, awaiting the activation of their function, even as they passively inscribe a social dynamic of the time into the diegesis (e.g. the valet standing by with drinks). On the other hand, both their greater appearance in more spaces, and the greater frequency with which their own spaces appear, suggest a narrative agency in the period drama that their social status in historical reality did not necessarily allot to them. Power in plot doesn’t correlate to power in reality.
Establishing the above hypothesis would require much deeper research into both more period dramas, and into historical documents about the spatial movements of certain classes in the periods depicted (or, for that matter, in our own, if we take these series to be reflections upon class in the late twentieth century and early twenty-first centuries). Nonetheless, the students could not have made such an interesting claim in the first place without the collective close reading that went into treating shot analysis as data collection, which revealed to them patterns that they might otherwise not have observed. In the second place, their deep, direct, and dialogic encounters with narratives as data, and with data as a medium, is precisely what gave them the authority to imagine visualizing a relationship between characters and space as a means of reading Downton Abbey and Upstairs, Downstairs. Those visualizations—those moments of distancing themselves graphically from the details of the data so as to read the series—led them in turn to a stronger sense of authority over the claim itself, including admissions in their own essay that their hypothesis about space, character, and class would need significantly more data to come to solid conclusions.
Whether or not the hypotheses of these two groups would hold up finally as humanistic claims is not the point of our essay. Nor is the point simply that we have digitized shot analysis for the contemporary classroom, even if technological change is a precondition of what we are doing. Instead, we are treating technological change as enabling students to think about what humanists call reading, but experimenting with a more collective form of reading: in one of the clichés of the digital humanities, collaborative, yes, but anxiously social too; close and distant both, but all in the name of a speculative ethos meant to free students to read better—and to read, really read, more media today.
Works Cited
Bellour, Raymond. The Analysis of Film, edited by Constance Penley. Bloomington: Indiana University Press, 2000.
Bordwell, David. Making Meaning: Inference and Rhetoric in the Interpretation of Cinema. Cambridge: Harvard University Press, 1991.
Brinkema, Eugenie. The Forms of the Affects. Durham: Duke University Press, 2014.
Drucker, Johanna. Graphesis: Visual Forms of Knowledge Production. Cambridge: Harvard UniversityPress, 2014.
Galligan, Jennafer, Madeline Kushner, and Brynn Wilkins. “Spaces and Agency: How Downton Abbey and Upstairs, Downstairs Reject Notions of Character Agency.” Unpublished essay, “The Poetics of Television,” University of Rochester, Fall 2013.
Guillory, John. “Close Reading: Prologue and Epilogue.” ADE Bulletin 41, no. 3 (2011): 19-25.
Moretti, Franco. Distant Reading. New York: Verso, 2013.
________. Atlas of the European Novel, 1800-1900. New York: Verso, 1999.
_________. Graphs, Maps, Trees: Abstract Models for Literary History. New York: Verso, 2005.
Rosenberg, Daniel. “Data before the Fact.” In “Raw Data” Is an Oxymoron, edited by Lisa Gitelman, 15-40. Cambridge: The MIT Press, 2013.
Promise of online teaching for English tutors online
The research contains many case studies that investigate how universities and colleges utilized creative teaching and learning strategies throughout the epidemic, as well as how their students responded. As an example: Using pre- and post-tutoring exams and surveys, the researchers discovered that studying with an English tutor online increased students' performance on standardized examinations … Continue reading